 |
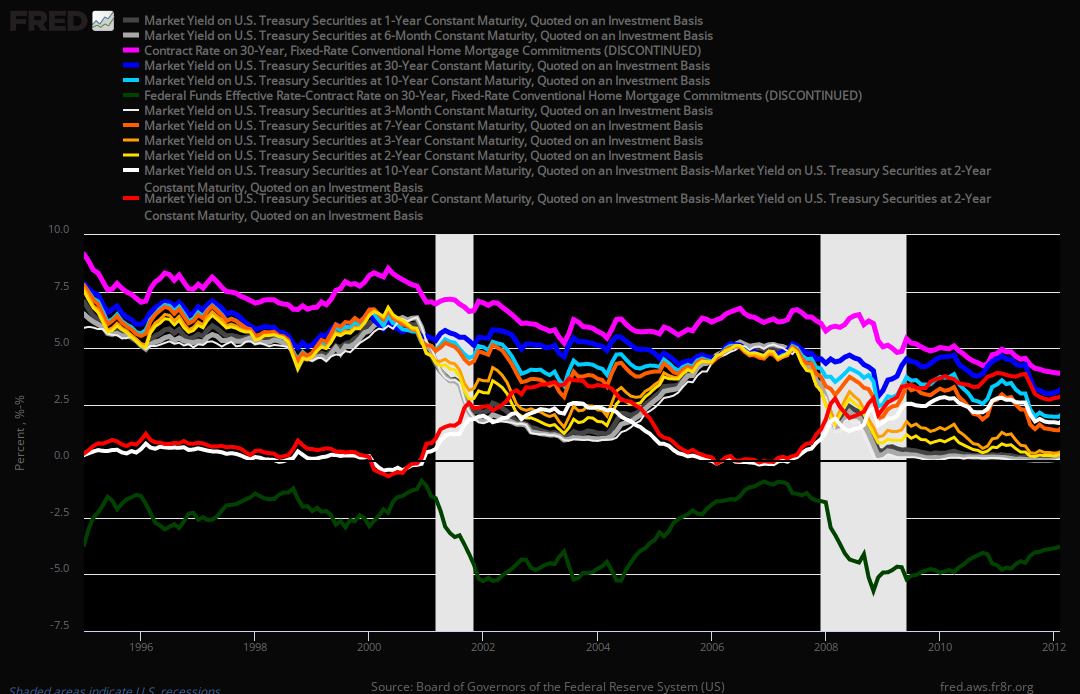
| T Curving 30 10 7 3 2 1 6mo 3mo 2yr spreads |
| Series | ‡ | T Curving 30 10 7 3 2 1 6mo 3mo (30,10: -2yr & ff -mortg) | (Scale) Size ‡ |
Period | ƒ(x) | ||
| 1 | GS1 | 1-Year Treasury Constant Maturity Rate | 5 | Solid | M | % | |
| 2 | GS6M | 6-Month Treasury Constant Maturity Rate | 5 | Solid | M | % | |
| 3 | MORTG | 30-Year Conventional Mortgage Rate | 5 | Solid | M | % | |
| 4 | GS30 | 30-Year Treasury Constant Maturity Rate | 5 | Solid | M | % | |
| 5 | GS10 | 10-Year Treasury Constant Maturity Rate | 4 | Solid | M | % | |
| 6 | FF-MORTG | Fed Funds - 30yr Conventional Mortgage Rate | 4 | Dashed | M | % | |
| 7 | GS3M | 3-Month Treasury Constant Maturity Rate | 2 | Solid | M | % | |
| 8 | GS7 | 7-Year Treasury Constant Maturity Rate | 4 | Solid | M | % | |
| 9 | GS3 | 3-Year Treasury Constant Maturity Rate | 3 | Solid | M | % | |
| 10 | GS2 | 2-Year Treasury Constant Maturity Rate | 3 | Solid | M | % | |
| 11 | DGS10-DGS2 | 10 yr - 2 yr | 4 | Dotted | M | % | |
| 12 | DGS30-DGS2 | 30 yr -2 yr | 4 | Dashed | M | % |
‡ The underlying chart, linked below the image above, does not use any symbols, has generally thinner lines, and covers many more years than the 15+ shown here.
No comments:
Post a Comment