Showing posts with label ƒ∝δατα. Show all posts
Showing posts with label ƒ∝δατα. Show all posts
Friday, December 14
Friday, June 22
x = “popper open society plato hexagon octagon circle”
ƒ(x) = google(x)

Plato's approximation of pi? « Division by Zero
divisbyzero.com/2012/06/20/platos-approximation-of-pi/2 days ago – Here's what Popper has to say (this is in his notes to Chapter 6 of The Open Society and its Enemies, Vol. 1, pp. ... of this curious fact is that it follows from the fact that the arithmetical mean of the areas of the circumscribed hexagon and the inscribed octagon is a good approximation of the area of the circle.The Open Society and Its Enemies: The spell of Plato - Google Books Result
books.google.com/books?isbn=0691019681...Karl Raimund Popper, Sir Karl Raimund Popper - 1971 - Medical - 368 pages
Karl Raimund Popper, Sir Karl Raimund Popper ... triangles r(VI+V3) The rectangle ABCD has an area exceeding that of the circle by less than 1 J ... of the areas of the circumscribed hexagon and the inscribed octagon is a good approximation ...Division by Zero
divisbyzero.com/2 days ago – Here's what Popper has to say (this is in his notes to Chapter 6 of The Open Society and its Enemies, Vol. 1, pp. ... of this curious fact is that it follows from the fact that the arithmetical mean of the areas of the circumscribed hexagon and the inscribed octagon is a good approximation of the area of the circle.Numbers - Google Books Result
¡ℜ» Plato's “House”
losersreview.blogspot.com/2012/04/platos.htmlApr 13, 2012 – “The rectangle ABCD has an area exceeding that of the circle by less than 1½ pro mille” ... mean of the areas of the circumscribed hexagon and the inscribed octagon is a ... Karl Popper - The Open Society and Its Enemies ...
Wednesday, May 2
“Cabbage” Contentions
on top of
James Rickards' Currency Wars
Is It Time to Invest in Europe?
(1:01:30) "...We've reached a point, The Profound Point in
Economic History: Where the truth is unpalatable to the political class.
And that truth is that the scale and the magnitude of the problem is larger than their ability to respond. And it terrifies them." -- Hugh Hendry, May Day 2012
h/t Lauren Lyster/Capital Account → Simone Foxman/Business Insider
America has, in fact, run trade deficits large enough t0 wipe out its gold hoard under the old rules of the game. Still, the idea of the gold standard was not to deplete nations of gold, but rather to force them to get their financial house in order long before the gold disappeared. In the absence of a gold standard and the real—time adjustments it causes, the American people seem unaware of how badly U.S. finances have actually deteriorated.
While this example may seem extreme, it is exactly how most of the world monetary system worked until forty years ago. In 1950, the United States had official gold reserves of over 20,000 metric tons. Due to persistent large trade deficits, at the time with Europe and japan rather than China, U.S. gold reserves had dropped to just over 9,000 metric tons when Nixon closed the gold window in 1971. That drop of 11,000 metric tons in the twenty—one years from 1950 to 1971 went mostly to a small number of export powerhouses.
p. 108

Wednesday, February 22
Physical Graffiti
“Oil Fuel Gold GDP S&P House”

| Series | Oil Fuel Gold GDP S-P House Physical Graffiti | (Scale) Size | Period | ƒ(x) | |||
| 1 | OILPRICE | Spot Oil Price: West Texas Intermediate | 5 | Solid | M | Chg, $/brl | |
| 2 | IQ11110 | Export (End Use): Fuel oil | 3 | Solid | M | % Chg fYA | |
| 3 | U6RATENSA | Total unemployed, plus * | 3 | Solid | M | Index (scV 100 fcp)‡ | |
| 4 | GVZCLS | CBOE Gold ETF Volatility Index | 1 | Solid | D, , cl | Chg fYA, % | |
| 5 | IQ12260 | Export (End Use): Nonmonetary gold | 3 | Solid | M | % Chg fYA | |
| 6 | GDP | Gross Domestic Product, 1 Decimal | 4 | Solid | Q | % Chg fYA | |
| 7 | SP500 | S&P 500 Index | 1 | Solid | D | % Chg fYA | |
| 8 | USSTHPI | House Price Index for the United States | 4 | Solid | Q | Index (scV 100 fcp)‡ | |
| 9 | SP500 / OILPRICE | S&P 500 / OILPRICE | 3 | Dotted | M | Index / ($/brl) | |
| 10 | MSPNHSUS / OILPRICE | Median Sales Price for New Houses / OILPRICE † | 3 | Dotted | M | x / 1000 |
* all marginally attached workers plus total employed part time for economic reasons
‡ (scale value to 100 for chosen period = Recession Trough Nov 1, 2011
† us$1,000
‡ (scale value to 100 for chosen period = Recession Trough Nov 1, 2011
† us$1,000
Monday, February 20
Mish Math i
Shed's (Disability Fraud) Spread

| Series | Mish Math i | (Scale) Size | Period | ƒ(x) | |||
| 1 | LNU00074597 | Population with a Disability * | 4 | Solid | M | Thousands of Persons | |
| 2 | GDP | Gross Domestic Product, 1 Decimal | 2 | Solid | Q | % Chg fYA | |
| 3 | U6RATE | Total unemployed, plus ‡ | 4 | Solid | M | % | |
| 4 | UNRATENSA | Civilian Unemployment Rate | 4 | Solid | M | % | |
| 5 | UNRATENSA * 1.377 | Mish-timated Unemp. Rate with 25% Fraud | 5 | Dotted | M | % * 1.377 | |
| 6 | UNRATENSA * 1.125 | Mish-timated Unemp. Rate with 10% Fraud | 5 | Dashed | M | % * 1.125 |
* Civilian Noninstitutional, 16 years and over
‡ all marginally attached workers plus total employed part time for economic reasons
‡ all marginally attached workers plus total employed part time for economic reasons
DEF CON Artistry

| Series | DEF CON huh ? | (Scale) Size | Period | ƒ(x) | |||
| 1 | DGI | Federal National Defense Gross Investment | 2 | Solid | Q | Chg fYA, Bil $ | |
| 2 | DGIC96 | Real National Defense Gross Investmen | 3 | Solid | Q | Bil Chd2005 $ | |
| 3 | FDEFX | National Defense Consumption Expend. & Gross Investment | 2 | Solid | Q | % Chg fYA | |
| 4 | FGRECPT | Federal Government Current Receipts | 2 | Solid | Q | Bil $ | |
| 5 | FGEXPND | Federal Government: Current Expenditures | 1 | Solid | Q | % Chg fYA | |
| 6 | GDP | Gross Domestic Product, 1 Decimal | 2 | Solid | ~A | Bil $ | |
| 7 | FYGFD | Gross Federal Debt | 2 | Solid | A, FY | Bil $ | |
| 8 | DGIC96/FYGFD | (#2 / #7) Defense Gross Investment / Gross Federal Debt | 3 | Dotted | A | Bil Chd2005 $ ‡ | |
| 9 | FGRECPT/FYGFD | (#4 / #7) Current Receipts / Gross Federal Debt | 3 | Dashed | A | x * 100 | |
| 10 | FGEXPND/FYGFD | (#5 / #7) Current Expenditures / Gross Federal Debt | 3 | Dashed | A | x * 100 |
‡ (*5000)-6
Sunday, February 19
Saturday, February 18
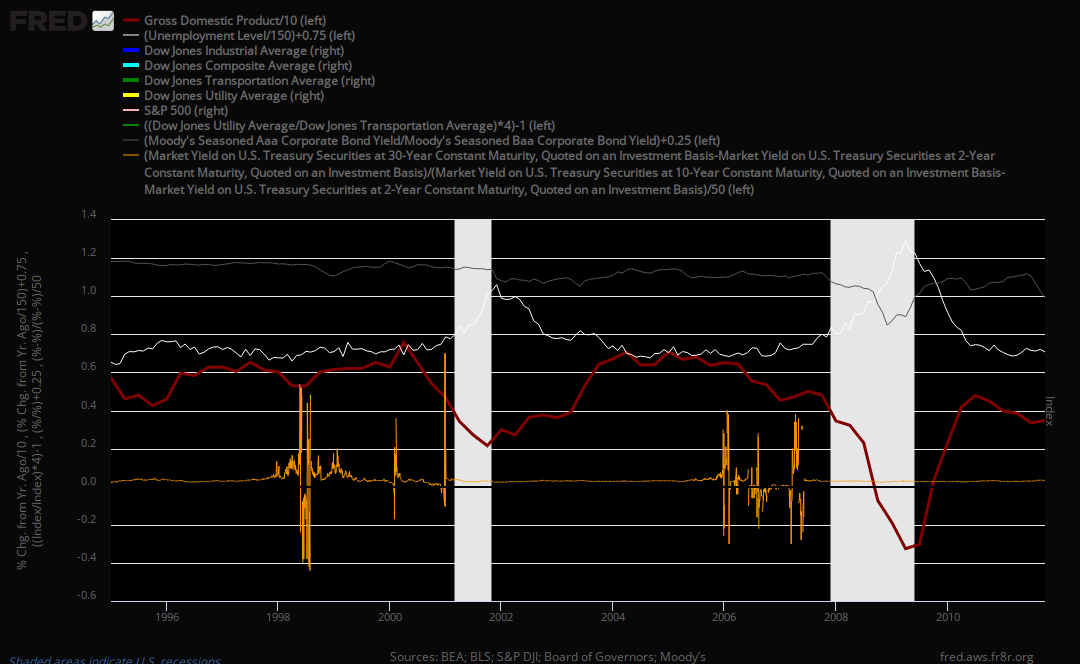
Moody's Aaa/Baa, Unemployed, GDP, Dow Jones ...
 |
| click the image to open full size in a new window |
... Utilities Over Trans., S&P, and “Spiky”
Having only a chimerical clue to what – if anything – these charts might be saying to a seasoned trader or (un)ideologically compromised economist, it's still easy to vouch for their intriguing nature. The “Spiky” orange line recalls a “Treasury spreads' ratio” for the differences between 30-year and 2-year to 10-year and 2-year bills.
Friday, February 17
Spiking Ratios

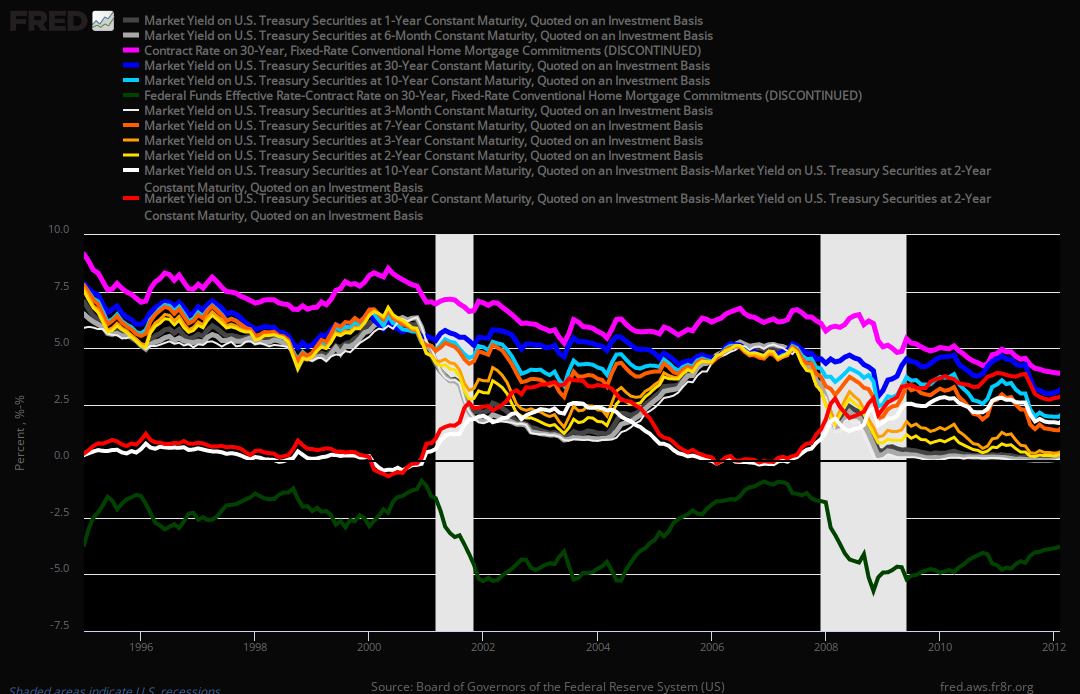
“T Curving
GDP FF DEBT MORTG
30 10 2 1
spiky spreads”
Go play with the unvarnished chart. Cool links under the legend's series column. Cheers!GDP FF DEBT MORTG
30 10 2 1
spiky spreads”
Thursday, February 16
Wednesday, February 15
Tuesday, February 14
Oil FF HOUST Personal-ie Unemployed ...
... GDP Fed DEBT CPI CMDEBT & A Little Bit Of Gold


Three time frames for one collection of data.
You can work with the charts at the FrED with these links: 1946 1985 2004
| Series | Oil Gold FF HS U/E Personal-ie gdp Fdebt cpi cmdebt | (Scale) Size ‡ |
Period | ƒ(x) | |||
| 1 | OILPRICE | Spot Oil Price: West Texas Intermediate | 2 | Solid | M | % Chg fYA | |
| 2 | GVZCLS | CBOE Gold ETF Volatility Index | 2 | Solid | Bi-W (m) | % Chg fYA | |
| 3 | FF | Effective Federal Funds Rate | 1 | Solid | W (w) | % | |
| 4 | HOUST | New Privately Owned Housing Units Started | 1 | Solid | M | % Chg fYA | |
| 5 | UNEMPLOY | Unemployed | 1 | Solid | M | % Chg fYA | |
| 6 | DPIC96 | Real Disposable Personal Income | 2 | Solid | Q | % Chg fYA | |
| 7 | PCEC96 | Real Personal Consumption Expenditures | 2 | Solid | M | % Chg fYA | |
| 8 | GFDEBTN | Federal Government Debt: Total Public Debt | 1 | Dotted | Q(eop) | % Chg fYA | |
| 9 | CPIAUCSL | Consumer Price Index for All Urban Consumers: All Items | 2 | Solid | M | % Chg fYA | |
| 10 | CMDEBT | Household Credit Market Debt Outstanding | 1 | Dashed | Q(eop) | % Chg fYA | |
| 11 | GDP | Gross Domestic Product, 1 Decimal | 2 | Solid | Q | % Chg fYA |
‡ Line sizes listed for 1946 chart. Line and marker weights increase through charts for 1985 and 2004.
Subscribe to:
Posts (Atom)


